Much attention is today focused on ways to valorize data generated by urban systems and infrastructures supported by networked digital technologies. To this point, I discussed the question and importance of ‘where the data is from’ in a previous article. In the case of data from our cities’ electricity networks, specifically, it is in many instances the electricity meter that generates the data necessary to track consumption. Today in many countries so-called smart meters are being deployed and developers and designers are thinking hard how to make best use of these devices, their capabilities and the data they are capable to generate. To grasp the full significance of what real time electricity metering encompasses let us take a very brief look the history of electricity metering.
Electric metering first became an issue when it was used for powering spark lamps in the 1870’s and the need arose to bill customers. Since each lamp’s required voltage was known and the current was constant, the unit of measurement that emerged was lamp-hours and related simply to the measured time of current flowing through lamps. As electricity powered devices became more diverse, a number of devices for measuring were invented using different approaches: chemical ampere-hour meters based on zinc plates connected to the customer’s circuit – electrodes were then weighed each month to establish billing; induction meters as AC became available; etc.
In order to account for the electricity used by customers of his first New York City power station, Thomas Edison developed the first electric wattmeter in the form of the Chemical meter. Based on the transfer of metal on an electrode in proportion to the current, an employee would regularly have to stop by the meter, take the electrode out and weigh it to determine a customer’s consumption to be billed.
What was common to all of these approaches was that the act of reading values was a manual and in-situ process and in early cases required the substitution of material for measuring purposes (R. C. Lanphier, Electric meter history and progress, Sangamo Electric Co., Springfield, Ill., 1925). Automatic readers did not emerge until the 1970’s with Paraskevakos’ patent for a remote meter based on the automatic telephone line identification system (T. G. Paraskevakos, “Sensor monitoring device,” Paraskevakos Electronics & Communication, Inc., USA, 10/15/1974, US3842208 A). Automatic meter reading has since moved from monthly readings to instant always-on systems providing remote readings at hourly or smaller intervals. ‘Smart meters’ are a further development in that they enable two-way communication between the utility provider and the client metering device.
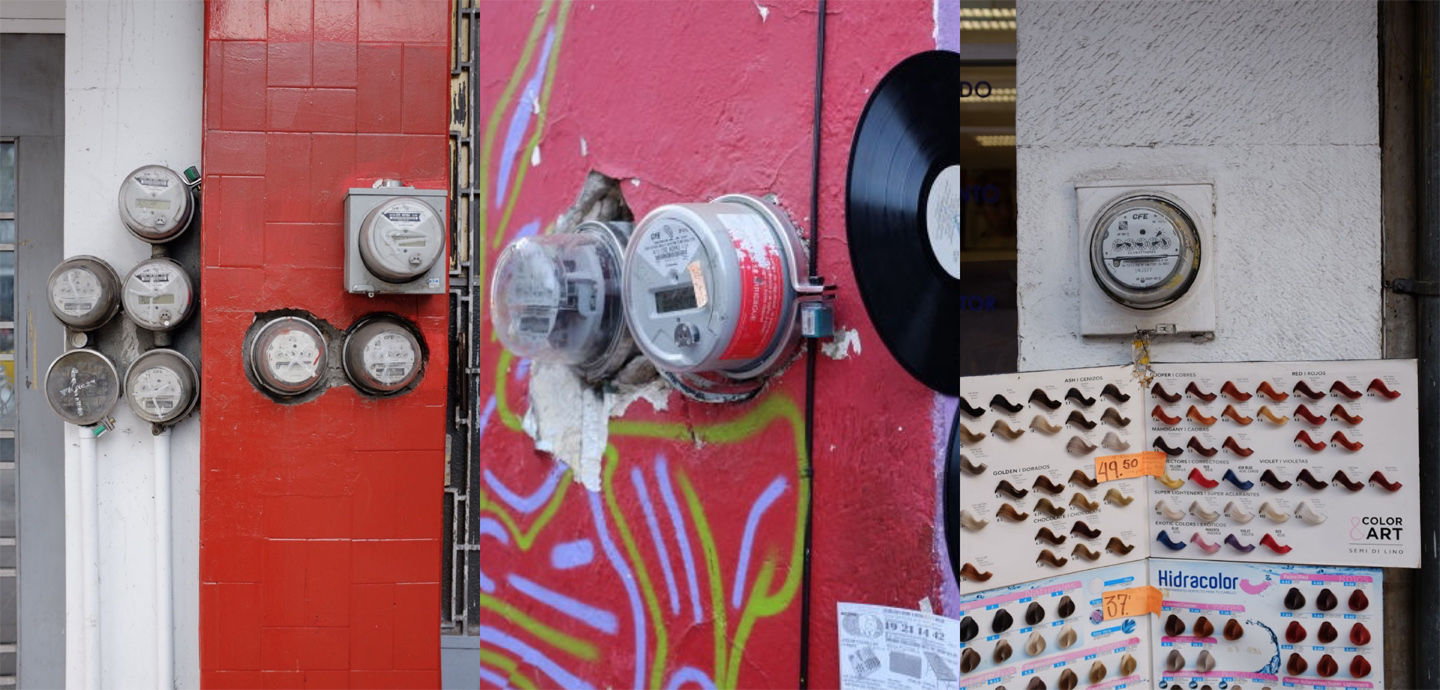
Smart Meters deployed in Guadalajara, Mexico.
Metering of energy consumption has shifted from an ‘after the fact’ reading for billing purposes, to a real-time information exchange to dynamically support effective supply and consumption behavior (F. Benzi et al., “Electricity smart meters interfacing the households,” Industrial Electronics, IEEE Transactions on, 58, 2011, IEEE, pp. 4487; H. Farhangi, “The path of the smart grid,” Power and Energy Magazine, IEEE, 8, 2010, IEEE, pp. 18-28). As such, an energy flow is a flow of information and represents a much larger potential for new use scenarios due to the tight spatio-temporal connection between data and activity.
While traditional metering tools were effective for billing purposes, what then are the challenges in transforming present day data streams into tools capable to foster understanding and support action? How can we move from a vision of data for accounting purposes to one of data that informs understanding and becomes part of the activity as a new kind of tool?
Images from electricity meters in the featured image on top of this article are taken in Guadalajara, Mexico, pointing to some particularly creative practices around meter installation and use.
Much attention is today focused on ways to valorize data generated by urban systems and infrastructures supported by networked digital technologies. To this point, I discussed the question and importance of ‘where the data is from’ in a previous article. In the case of data from our cities’ electricity networks, specifically, it is in many instances the electricity meter that generates the data necessary to track consumption. Today in many countries so-called smart meters are being deployed and developers and designers are thinking hard how to make best use of these devices, their capabilities and the data they are capable to generate. To grasp the full significance of what real time electricity metering encompasses let us take a very brief look the history of electricity metering.
Electric metering first became an issue when it was used for powering spark lamps in the 1870’s and the need arose to bill customers. Since each lamp’s required voltage was known and the current was constant, the unit of measurement that emerged was lamp-hours and related simply to the measured time of current flowing through lamps. As electricity powered devices became more diverse, a number of devices for measuring were invented using different approaches: chemical ampere-hour meters based on zinc plates connected to the customer’s circuit – electrodes were then weighed each month to establish billing; induction meters as AC became available; etc.
Based on the transfer of metal on an electrode in proportion to the current, an employee would regularly have to stop by the meter, take the electrode out and weigh it to determine a customer’s consumption to be billed.
What was common to all of these approaches was that the act of reading values was a manual and in-situ process and in early cases required the substitution of material for measuring purposes (R. C. Lanphier, Electric meter history and progress, Sangamo Electric Co., Springfield, Ill., 1925). Automatic readers did not emerge until the 1970’s with Paraskevakos’ patent for a remote meter based on the automatic telephone line identification system (T. G. Paraskevakos, “Sensor monitoring device,” Paraskevakos Electronics & Communication, Inc., USA, 10/15/1974, US3842208 A). Automatic meter reading has since moved from monthly readings to instant always-on systems providing remote readings at hourly or smaller intervals. ‘Smart meters’ are a further development in that they enable two-way communication between the utility provider and the client metering device.
Metering of energy consumption has shifted from an ‘after the fact’ reading for billing purposes, to a real-time information exchange to dynamically support effective supply and consumption behavior (F. Benzi et al., “Electricity smart meters interfacing the households,” Industrial Electronics, IEEE Transactions on, 58, 2011, IEEE, pp. 4487; H. Farhangi, “The path of the smart grid,” Power and Energy Magazine, IEEE, 8, 2010, IEEE, pp. 18-28). As such, an energy flow is a flow of information and represents a much larger potential for new use scenarios due to the tight spatio-temporal connection between data and activity.
While traditional metering tools were effective for billing purposes, what then are the challenges in transforming present day data streams into tools capable to foster understanding and support action? How can we move from a vision of data for accounting purposes to one of data that informs understanding and becomes part of the activity as a new kind of tool?
Images from electricity meters in the featured image on top of this article are taken in Guadalajara, Mexico, pointing to some particularly creative practices around meter installation and use.