This project is the precursor of the more recently released DataCollider and was developed as part of my tenure at the Massachusetts Institute of Technology’s Senseable City Lab where I led an interdisciplinary research team comprising computer scientists, architects, planners, and designers both in Boston and Singapore.
After having developed multiple projects with my colleagues at MIT that involved the visualization of urban data streams from existing infrastructures and networks, we wanted to find a way to streamline this process. Typically it would take us as an interdisciplinary team a few months to go through the various steps from data acquisition, data cleaning, processing, analysis, concept and prototype generation,… until the final visualization was complete.
This was an ad-hoc process every time anew and we thought it would be a worthwhile undertaking for us and others to develop a tool that could enable any person with limited technical background to go through that process in a fraction of that time and explore for themselves different perspectives on cities ‘through the eyes of data’.
The Data Browser project focuses on the development of a software tool for the visual exploration and manipulation of large data sets and real time data streams. Multiple data sets and streams from heterogeneous sources and very different in nature can be connected, processed and visualized dynamically to generate new insights into related urban dynamics. The kinds of data the Data Browser addresses primarily are those raw data generated by infrastructures, systems and networks managed by digital technologies that increasingly pervade our cities, such as telecommunication networks, energy grids, logistics networks, transportation networks, sensor networks and similar.
Users can interact with the data streams by selecting parts of data sets they are interested in, selecting operations to be performed on the data to extract meaning and combining the data with a range of visualization modalities, to see in real time how data is transformed into visual expression that can be readily consulted by an extended user group.
Along the process, users can change parameters as well as interact with the resulting visualization to make adjustments that support the exploration of different aspects of the data sets. In a metaphorical way, the Data Browser allows users to ‘put their hands into Big Urban Data’.
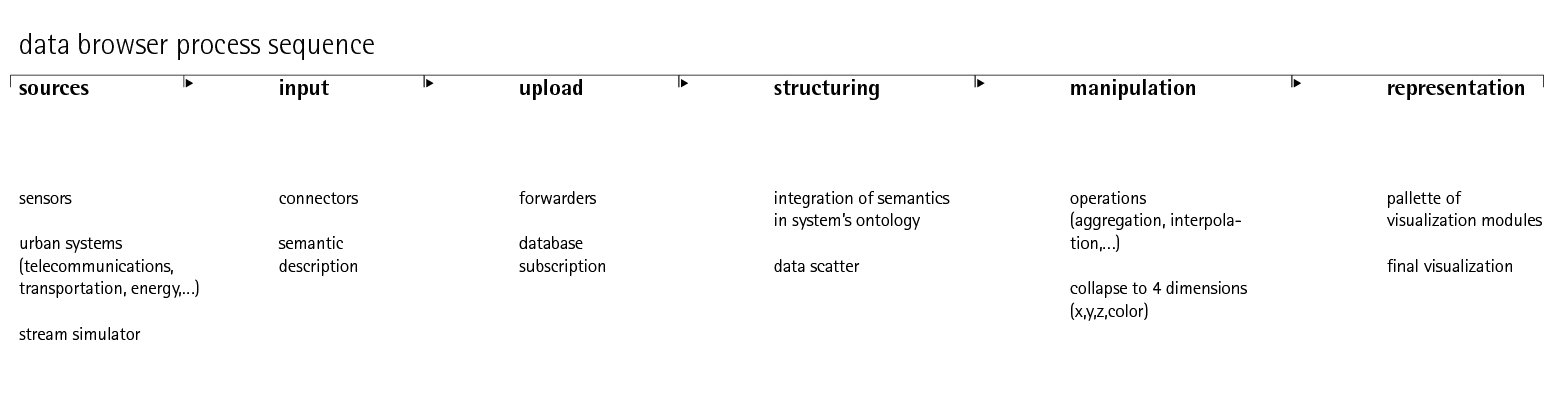
The following scheme illustrates the process sequence from the raw data source to the final visual representation of information.
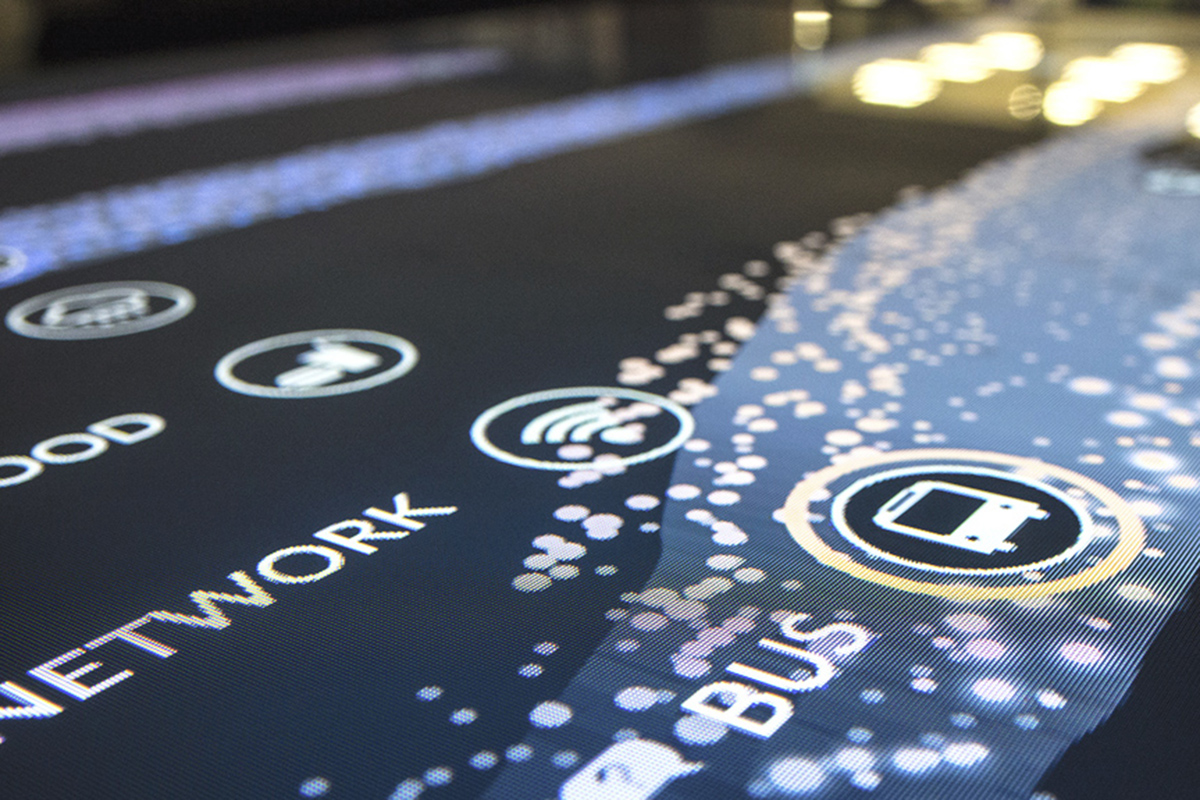
An initial prototype of the Data Browser was presented in March 2013 at the Future Urban Mobility Symposium at the National University of Singapore with an interactive interface composed of a large multi-touch screen.
Below some initial diagrams exploring information structure and interface to guide users of the browser through the sequence of steps.
Team
Kristian Kloeckl, project leader
Oliver Senn
Martina Maitan
Ramprasad Sivaprakasam
Mohit Shah
Brian Jacobs
Carlo Ratti, director
Assaf Biderman, associate director
This project is the precursor of the more recently released DataCollider and was developed as part of my tenure at the Massachusetts Institute of Technology’s Senseable City Lab where I led an interdisciplinary research team comprising computer scientists, architects, planners, and designers both in Boston and Singapore.
After having developed multiple projects with my colleagues at MIT that involved the visualization of urban data streams from existing infrastructures and networks, we wanted to find a way to streamline this process. Typically it would take us as an interdisciplinary team a few months to go through the various steps from data acquisition, data cleaning, processing, analysis, concept and prototype generation,… until the final visualization was complete.
The Data Browser project focuses on the development of a software tool for the visual exploration and manipulation of large data sets and real time data streams. Multiple data sets and streams from heterogeneous sources and very different in nature can be connected, processed and visualized dynamically to generate new insights into related urban dynamics. The kinds of data the Data Browser addresses primarily are those raw data generated by infrastructures, systems and networks managed by digital technologies that increasingly pervade our cities, such as telecommunication networks, energy grids, logistics networks, transportation networks, sensor networks and similar.
Users can interact with the data streams by selecting parts of data sets they are interested in, selecting operations to be performed on the data to extract meaning and combining the data with a range of visualization modalities, to see in real time how data is transformed into visual expression that can be readily consulted by an extended user group.
Along the process, users can change parameters as well as interact with the resulting visualization to make adjustments that support the exploration of different aspects of the data sets. In a metaphorical way, the Data Browser allows users to ‘put their hands into Big Urban Data’.
The following scheme illustrates the process sequence from the raw data source to the final visual representation of information.
An initial prototype of the Data Browser was presented in March 2013 at the Future Urban Mobility Symposium at the National University of Singapore with an interactive interface composed of a large multi-touch screen.
Below some initial diagrams exploring information structure and interface to guide users of the browser through the sequence of steps.
Team
Kristian Kloeckl, project leader
Oliver Senn
Martina Maitan
Ramprasad Sivaprakasam
Mohit Shah
Brian Jacobs
Carlo Ratti, director
Assaf Biderman, associate director