City of Quincy Welcome Center
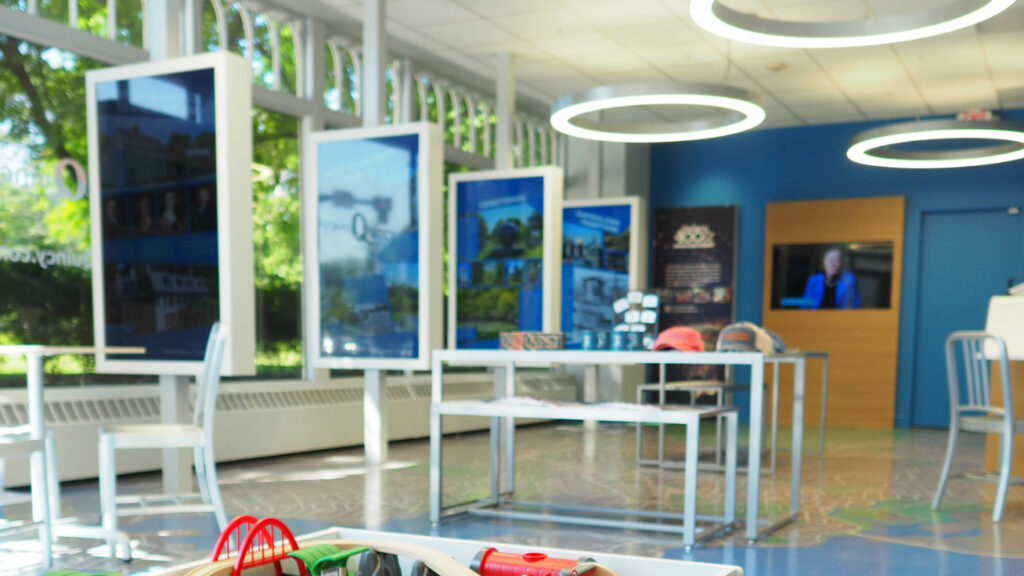
In preparation of the 400 year anniversary of the settlement of the City of Quincy, InformationInAction carried out extensive stakeholder research, concept development, and designed the interior space, information design and holistic visitor experience for the City’s new Welcome Center.
Trails Connect | Quarry Trail
Trail survey and GPS-based digital trail publication to help bring an important green trail back into public visibility. Improving the findability, legibility, and walkability of this trail creates a walking connection to the Blue Hills Reservation hiking trail network for residents of an entire urban neighborhood.
Legible City Initiative
Ongoing collaboration with the City of Quincy on a comprehensive Legible City Initiative. The high level objective is multifold. On one hand, to…
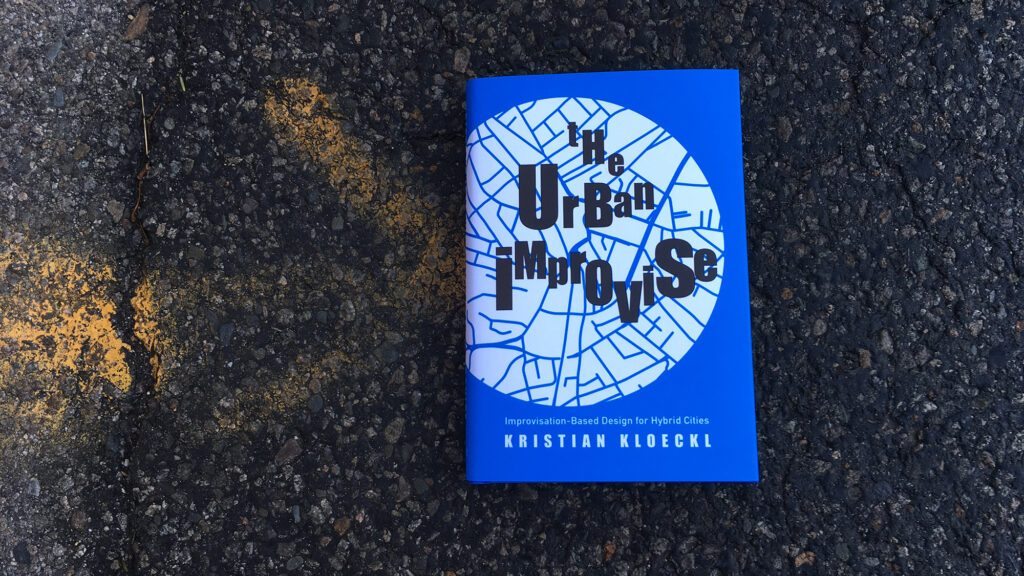
Book: The Urban Improvise (Yale University Press)
A book for architects, designers, planners, and urbanites that explores how cities can embrace improvisation to enhance urban life.
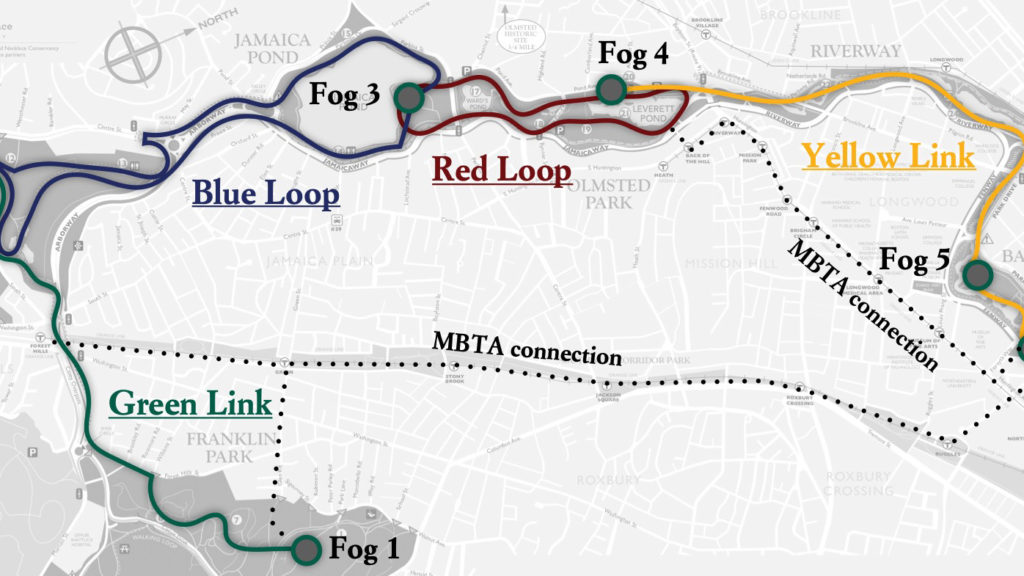
Wayfinding Strategy for the Emerald Necklace
Wayfinding strategy and concept development for the Emerald Necklace Conservancy’s 20th anniversary installation of fog sculptures by Fujiko Nakaya as part of my…
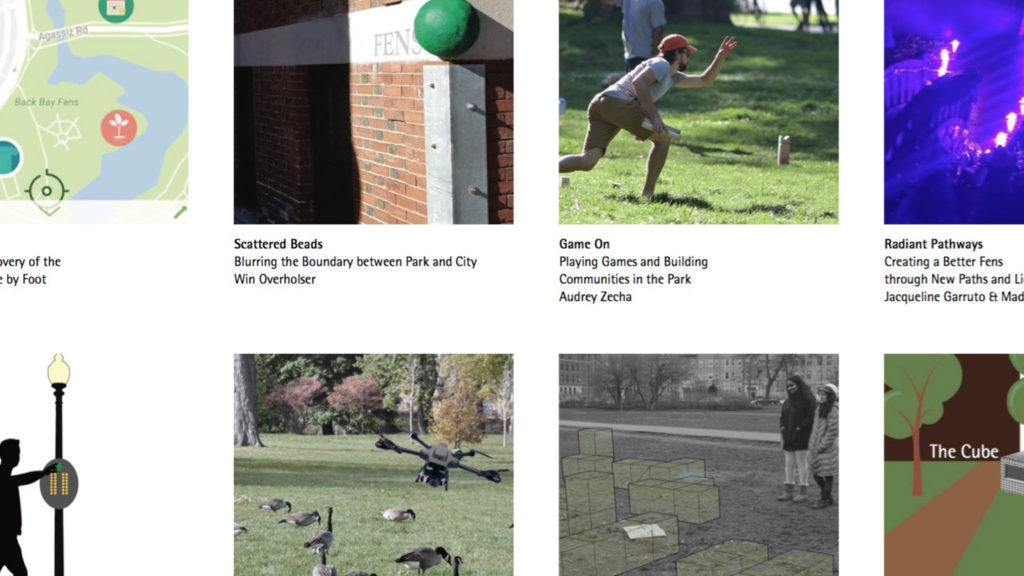
Exhibition: Experience Design for Boston’s Emerald Necklace
As part of our Experience Design Studio organized in collaboration with the Emerald Necklace Conservancy, students from the Experience Design BA program at…
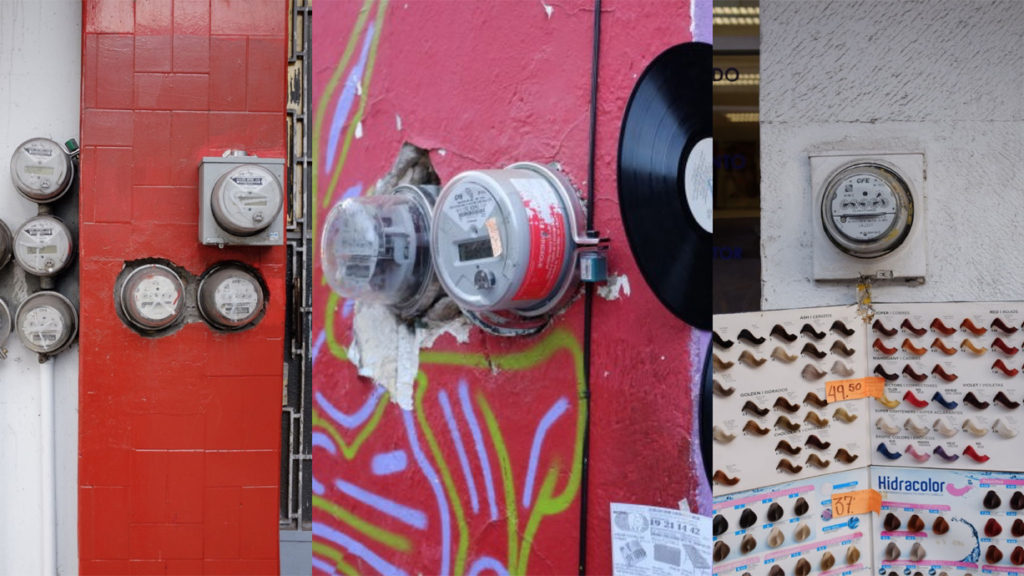
From lamp-hours to smart meters
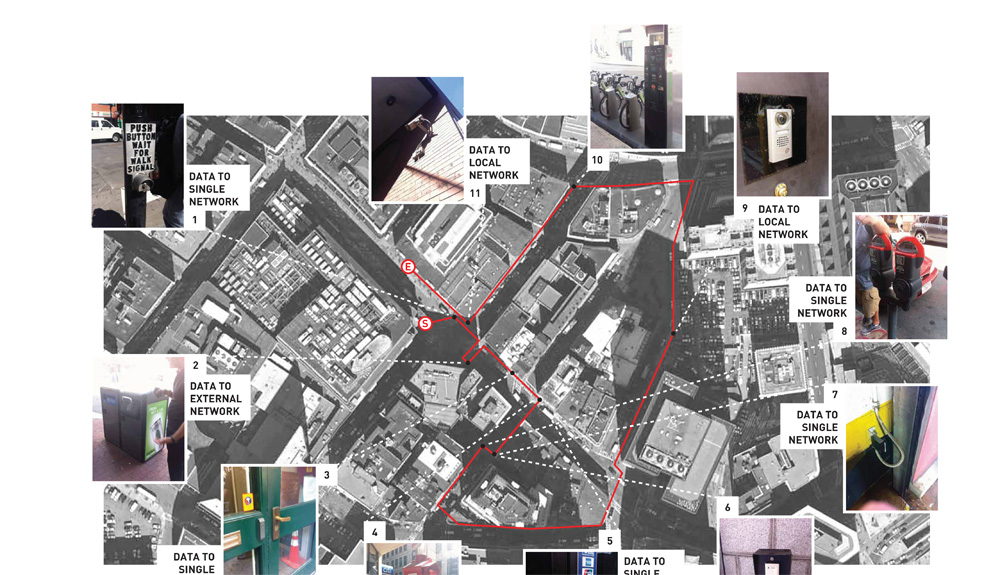
Much attention is today focused on ways to valorize data generated by urban systems and infrastructures supported by networked digital technologies. To this…
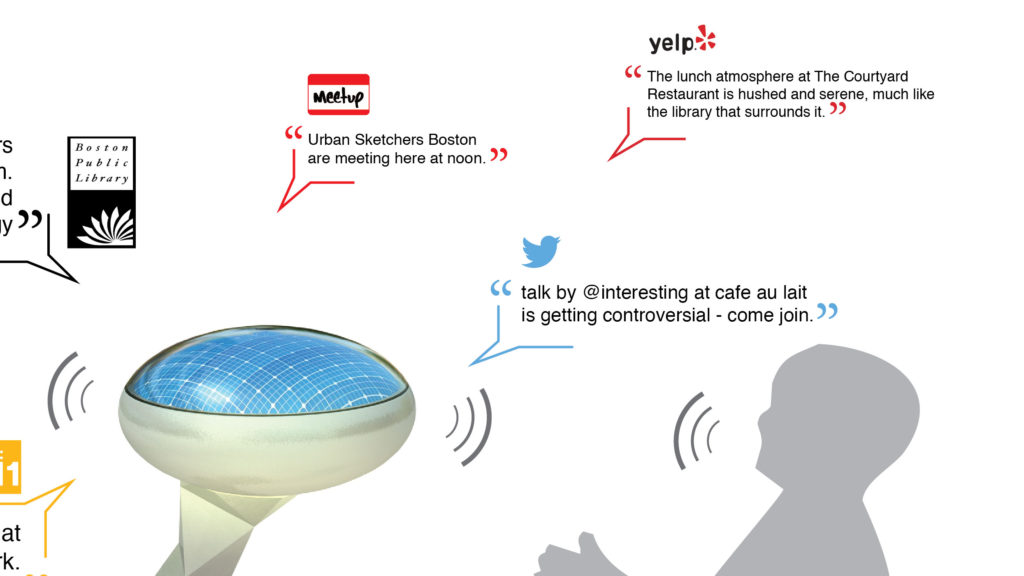
PlaceTalk | Situating hyper-local online conversations
As much of our daily conversations have moved to online environments, this project brings these conversations back into the public spaces of cities…
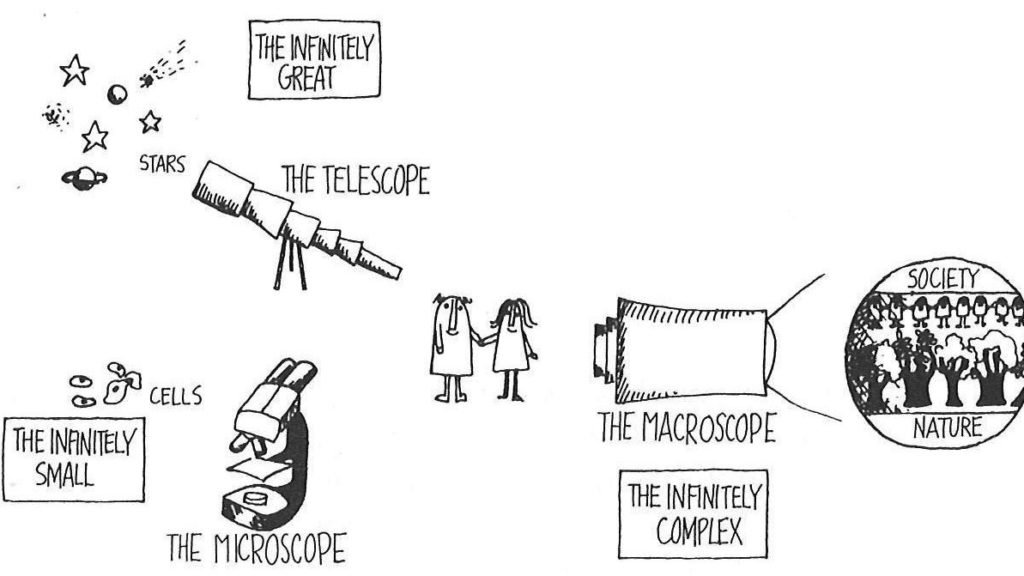
Mediation theory and the design with urban systems data
In the process of working with large systems data, data visualization has become a powerful tool for both the representation of information as…
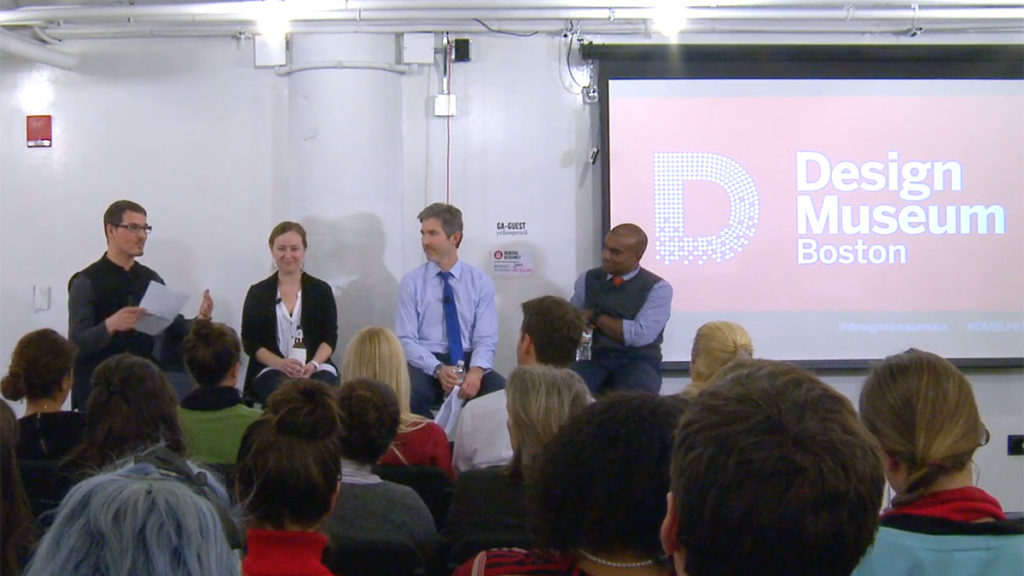
Video: Boston Design Museum Data Visualization Panel
Watch the video from our panel discussion from earlier this year on Data Visualization. Organized by the Boston Design Museum, I had the…
Visual Energy Flows
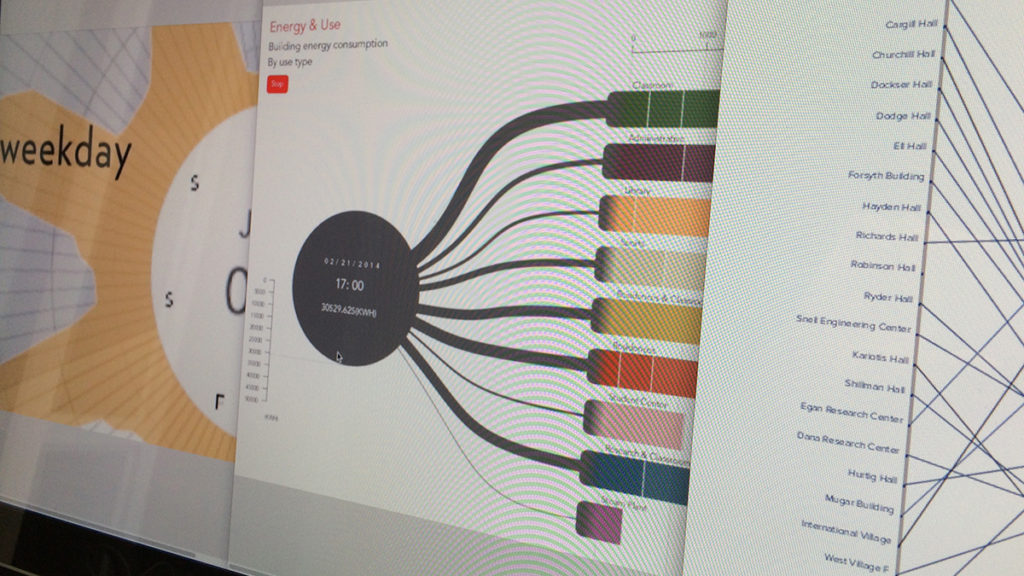
Over the course of one semester I worked with a group of graduate students on the exploration of designing and developing novel and meaningful ways of representing energy systems data…
Rashômon and the wicked problem of viewpoints
In a recent conversation at his studio in Newport, Richard Saul Wurman reminded me of the terrific Japanese movie classic Rashômon and pointed…
Panel Discussion on Data Visualization
UNITE on Data Visualization February 19th, 2015, 6:30-8:30pm General Assembly – 51 Melcher Street, Boston, MA 02210 I look forward to moderating…
The origin of data – Energy systems at Northeastern
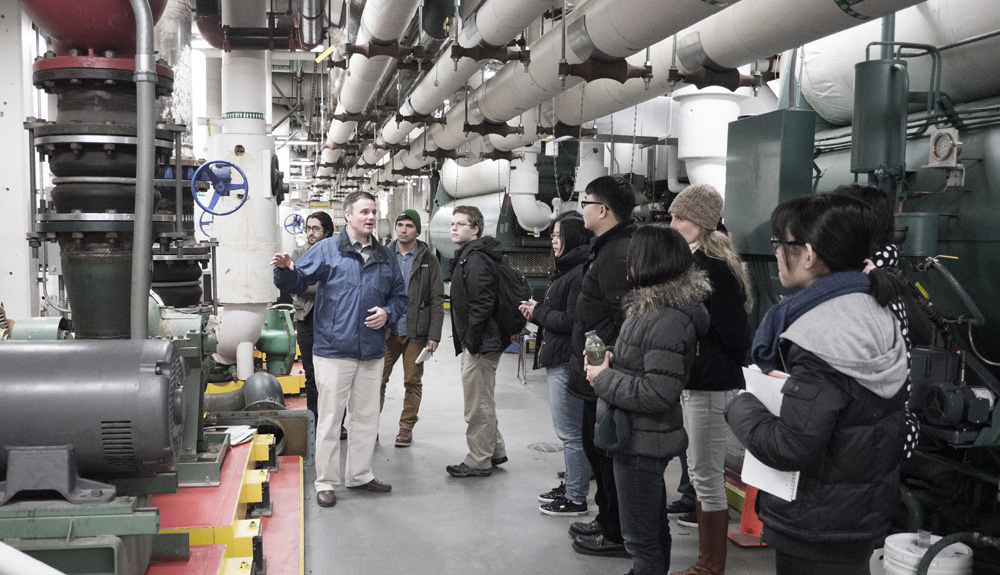
My class students, my teaching assistant Corey Hoard and I, recently followed Northeastern University’s Energy Manager Joe Ranahan on a tour through some…
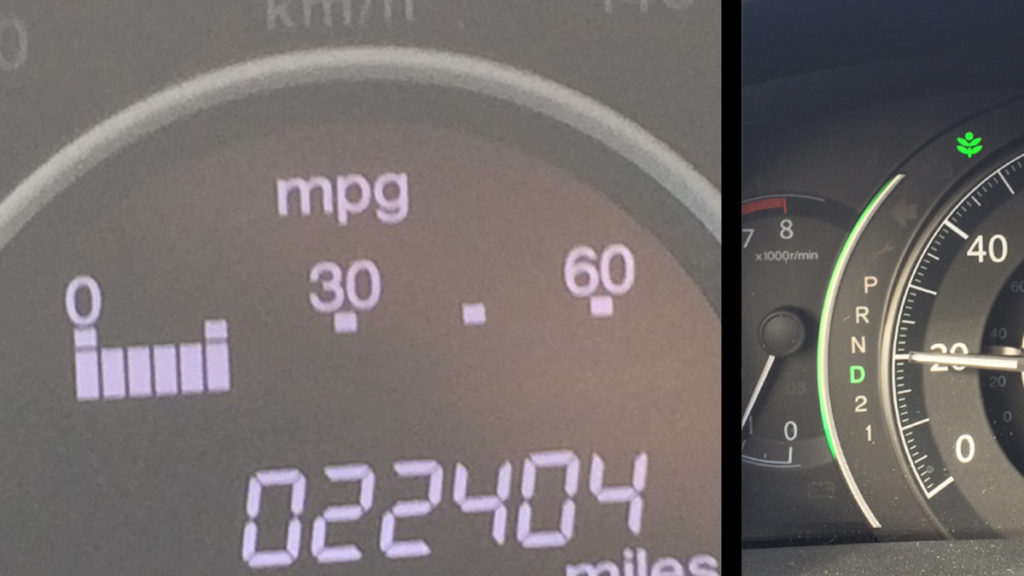
Real time feedback on the impact of our actions: the instant MPG readout
I recently spent some time with my in-laws and drove their car for a few days. I was struck by the effectiveness of…
course: Designing with urban data
This graduate course was offered at the Northeastern University School of Architecture in Fall 2014-15 and was a pilot for the subsequent course…
Data Browser
The Data Browser project focuses on the development of a software tool for the visual exploration and manipulation of large data sets and real time data streams. Multiple data sets and streams from heterogeneous sources and very different in nature can be connected, processed and visualized…
course: Digital City Design Workshop – Cape Town
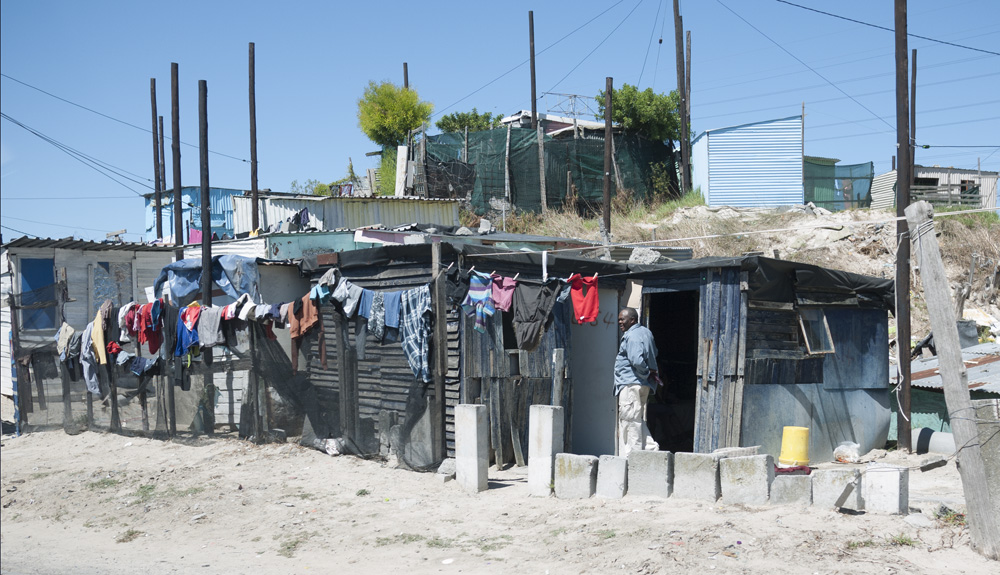
We visited Cape Town in March 2013 to explore how leveraging digital technologies in the realm of transportation could provide people (often living in remote townships) with better access to opportunities…
Visual Explorations of Urban Mobility
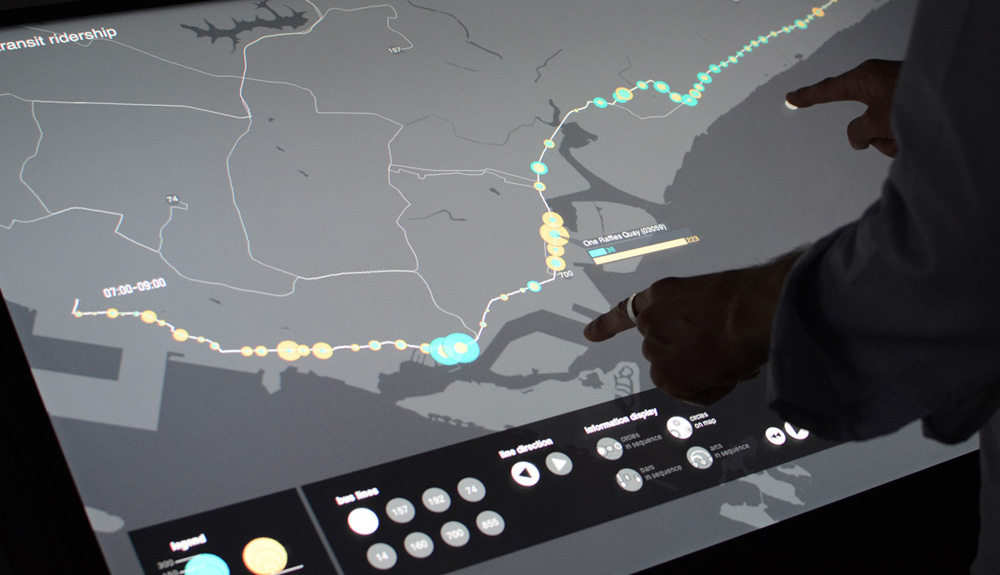
In collaboration with Singapore’s Land Transport Authority we have developed a number of interactive visual applications to explore the wealth of information concealed in some of the mobility data generated throughout the island…
course: Digital City Design Workshop – Rio de Janeiro
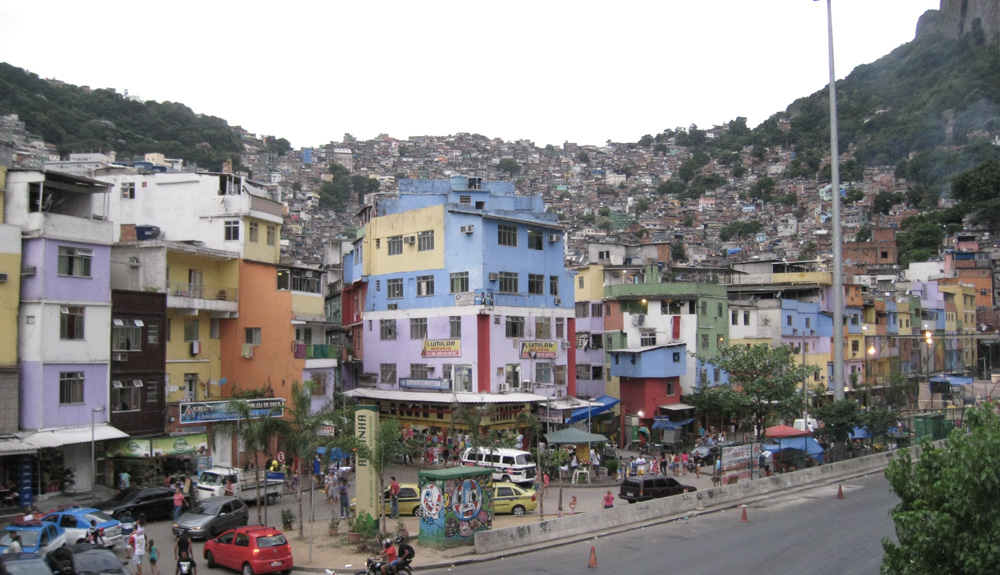
Within this context transportation, specifically the mobility of people, goods and information is key to overcoming the spatial, and perhaps even social, divisions. Coordination of mobility, Zones of transition, Connecting layers of digital information…
