Today, cities are densely interwoven with digital systems and networks. Increasing aspects of people’s lives involve in one way or the other the direct or indirect use of these digital technologies. Often, devices are connected and generate an enormous data trace as a function of human activity and interaction with and through such technology systems. While such data is generated by default, it remains untapped and inert unless transformed and structured as relevant information and represented in meaningful ways. In order for information to play a constructive and positive role, it needs to be something that people can “make their own” and act upon.
Skye Moret-Ferguson
Xuan Zhang
Xiaxin Chen
Jessica Hopkins
Mahima Pushkarna
The Information Design Studio 2 in Spring 2015 was dedicated to the exploration of how data and information from a specific real-world context can be elaborated so as to become meaningful and instrumental in people’s lives. Taking the Northeastern University campus as a “city in a city” model, we worked on ways to uncover the potential of the massive amounts of data generated by the campus electricity network through different methods of data visualization (this studio course is part of the more comprehensive research initiative Northeastern Energy Flows).
Xiangyi Fu
Armin Akhavan
Aldo Viramontes
Jin Wang
Yangdong Ye
The Northeastern University campus lends itself well to working on the topic of urban energy data. It is a rather large campus in an urban setting and is characterized by sophisticated energy systems due to a recent focus on implementing energy saving technologies and energy monitoring systems (the University in 2014 placed 3rd among 301 schools from 61 countries and 1st among US Universities in the University of Indonesia’s fourth annual GreenMetric Ranking of World Universities). A growing number of sensors provide real-time monitoring of energy flows as well as complementary readings of room occupancy. For this project the data comprised energy consumption readings for all buildings of the Northeastern University main campus in Boston at 15 minute intervals for the past 15 years. Additional datasets provided details about building age, surface areas used for specific use types (classroom, residential, office,…), and similar, totalling over 3 million data points comprehensively.
Over the course of one semester students engaged in the exploration of designing and developing novel and meaningful ways of representing energy systems’ data from the Northeastern University campus to provide better understanding, public engagement as well as the usage of this data for novel perspectives on campus dynamics. This course was carried out in collaboration with the Northeastern University Department of Facilities (Energy Group).
Today, cities are densely interwoven with digital systems and networks. Increasing aspects of people’s lives involve in one way or the other the direct or indirect use of these digital technologies. Often, devices are connected and generate an enormous data trace as a function of human activity and interaction with and through such technology systems. While such data is generated by default, it remains untapped and inert unless transformed and structured as relevant information and represented in meaningful ways. In order for information to play a constructive and positive role, it needs to be something that people can “make their own” and act upon.
The Information Design Studio 2 in Spring 2015 was dedicated to the exploration of how data and information from a specific real-world context can be elaborated so as to become meaningful and instrumental in people’s lives. Taking the Northeastern University campus as a “city in a city” model, we worked on ways to uncover the potential of the massive amounts of data generated by the campus electricity network through different methods of data visualization (this studio course is part of the more comprehensive research initiative Northeastern Energy Flows).
The Northeastern University campus lends itself well to working on the topic of urban energy data. It is a rather large campus in an urban setting and is characterized by sophisticated energy systems due to a recent focus on implementing energy saving technologies and energy monitoring systems (the University in 2014 placed 3rd among 301 schools from 61 countries and 1st among US Universities in the University of Indonesia’s fourth annual GreenMetric Ranking of World Universities). A growing number of sensors provide real-time monitoring of energy flows as well as complementary readings of room occupancy. For this project the data comprised energy consumption readings for all buildings of the Northeastern University main campus in Boston at 15 minute intervals for the past 15 years. Additional datasets provided details about building age, surface areas used for specific use types (classroom, residential, office,…), and similar, totalling over 3 million data points comprehensively.
Over the course of one semester students engaged in the exploration of designing and developing novel and meaningful ways of representing energy systems’ data from the Northeastern University campus to provide better understanding, public engagement as well as the usage of this data for novel perspectives on campus dynamics. This course was carried out in collaboration with the Northeastern University Department of Facilities (Energy Group).
This work forms part of the more comprehensive research initiative Northeastern Energy Flows.
Pulse of an Arena
by Skye Moret
All buildings are (not) created equal
by Aldo Viramontes
Energy Data Rings
by Xiaxin Chen
Energy Fluctuations
by Jessica Hopkins
NEU Energy Sonogram
by Armin Akhavan
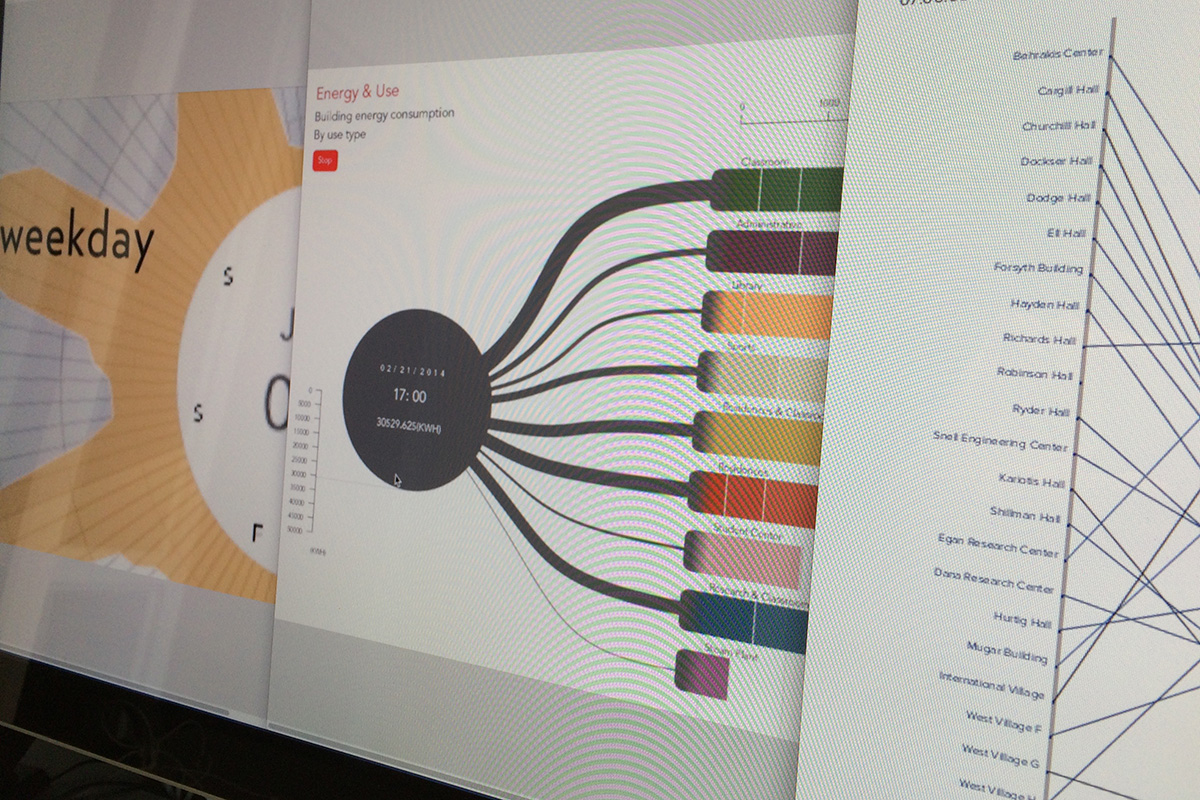
Campus Energy Consumption by Building Use Type
by Xuan Zhang
Age and Energy
by Xiangyi Fu
Energy/Occupancy
by Mahima Pushkarna
Weekly Building Energy Consumption
by Jin Wang
Energy Consumption over Time
by Yangdong Ye
Northeastern University
MFA Information Design and Visualization | Studio 2 | Spring 2015
Instructor
Kristian Kloeckl
Teaching Assistant
Corey Hoard
External Advisor
Joe Ranahan
Students Armin Akhavan, Xiaxin Chen, Xiangyi Fu, Jessica Hopkins, Skye Moret-Ferguson, Mahima Pushkarna, Aldo Viramontes, Jin Wang, Yangdong Ye, Xuan Zhang