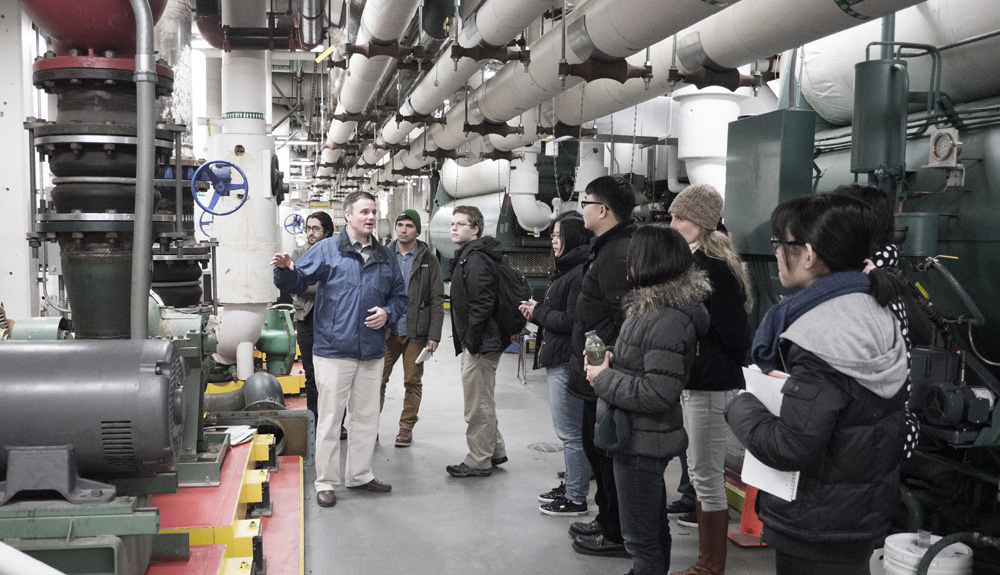
My class students, my teaching assistant Corey Hoard and I, recently followed Northeastern University’s Energy Manager Joe Ranahan on a tour through some of the hidden basement and roof floors on campus.
Why? In this semester’s Studio 2 of the Masters in Information Design and Visualization, we are working on ways to uncover the potential of the massive amounts of data generated by the campus electricity network through data visualization (this class is part of the more comprehensive research initiative Northeastern Energy Flows). And to do this, we wanted to find out for ourselves where and how this data is being generated.
“All too often work is done on data from urban systems without much understanding and direct exploration of the context in which that data is being generated.”
All too often work is done on data from urban systems without much understanding and direct exploration of the context in which that data is being generated. But in order to design meaningful visual expressions of that data it is imperative to dig deeper: It matters how the systems that generate the digital traces are set up, where the sensors that signals in response to specific events they detect are positioned, etc. Essentially, working with systems data without knowing the systems is like working with survey data without knowing the questions of the questionnaire.
The Northeastern University campus in particular lends itself well to working on the topic of urban energy data. It is a rather large campus in an urban setting resembling a ‘city within a city’ in many ways and is a good model for a more comprehensive urban context. The campus is characterized by sophisticated energy systems due to a recent focus on implementing energy saving technologies and energy monitoring systems (the University in 2014 placed 3rd among 301 schools from 61 countries and 1st among US Universities in the University of Indonesia’s fourth annual GreenMetric Ranking of World Universities). A growing number of sensors provide real-time monitoring of energy flows as well as complementary readings of room occupancy.
On our tour we saw many of the sources of energy data read outs, the pumps and fans of air heating and cooling systems in the basements and roof floors across campus. Take a look at the photos of some beautiful industrial engineering.
The electricity supply for the NEU campus comes in through a 14.000 Volt feed with an energy mix from the ISO New England electricity market into four substations on campus. Purchasing electricity at high voltage is less costly, and the University owns the substations and transformers in each building.
To a large extent the campus is divided into two distinct systems in terms of electricity with a separation along Forsyth street. This is no coincidence. Buried under Forsyth street runs a large water drain pipe and laying 14.000 Volt cables on top of this pipe was considered too close to the surface and thus too risky.
It turns out that lighting, while perhaps the most visible type of electricity consumption, does not in fact impact overall consumption greatly. There are motion detectors in many places that automatically switch off many of the indoor lighting sources in the absence of building occupants and there is an ongoing LED lamp substitution program that further reduces consumption of campus lighting.
As a rough estimated order of magnitude, the largest shares of electricity consumption are attributable to water pumps for the buildings’ air conditioning (hot/cold), chillers (in summer), air fans for air conditioning, and finally lighting. As Ranahan emphasizes, “moving air is a large part of the electricity consumption on campus”.
And in fact the Energy Group on campus goes to great lengths to better fine tune just how much air and water to move to the various rooms depending on actual room occupancy – since a well air-conditioned room without anybody in it is wasted energy. Some of the techniques in place to monitor room occupancy are CO2 sensors and people counters based on camera technology which literally track incoming and outgoing residents to calculate room occupancy in real time.
From a different perspective, energy inefficiency is also age dependent. As buildings get older, they “drift”: they loose their tune, they get out of calibration. Over the years, sensor set-ups, valves and other parts of the system become less accurate and this together with the attempts to locally compensate, results in performance loss and can lead to an overall increase in energy consumption of these buildings. The Energy Group has recently committed itself to tackling a gradual recommissioning of several of the older campus buildings. A laborious process including a full examination and recalibration of the various building systems, that should significantly reduce overall consumption.
The students certainly walked away from this tour with many inspiring and deep insights into where the data comes from. They will be working with this data for the rest of this semester. Stay tuned for more updates.
My class students, my teaching assistant Corey Hoard and I, recently followed Northeastern University’s Energy Manager Joe Ranahan on a tour through some of the hidden basement and roof floors on campus.
Why? In this semester’s Studio 2 of the Masters in Information Design and Visualization, we are working on ways to uncover the potential of the massive amounts of data generated by the campus electricity network through data visualization (this class is part of the more comprehensive research initiative Northeastern Energy Flows). And to do this, we wanted to find out for ourselves where and how this data is being generated.
All too often work is done on data from urban systems without much understanding and direct exploration of the context in which that data is being generated. But in order to design meaningful visual expressions of that data it is imperative to dig deeper: It matters how the systems that generate the digital traces are set up, where the sensors that signals in response to specific events they detect are positioned, etc. Essentially, working with systems data without knowing the systems is like working with survey data without knowing the questions of the questionnaire.
The Northeastern University campus in particular lends itself well to working on the topic of urban energy data. It is a rather large campus in an urban setting resembling a ‘city within a city’ in many ways and is a good model for a more comprehensive urban context. The campus is characterized by sophisticated energy systems due to a recent focus on implementing energy saving technologies and energy monitoring systems (the University in 2014 placed 3rd among 301 schools from 61 countries and 1st among US Universities in the University of Indonesia’s fourth annual GreenMetric Ranking of World Universities). A growing number of sensors provide real-time monitoring of energy flows as well as complementary readings of room occupancy.
On our tour we saw many of the sources of energy data read outs, the pumps and fans of air heating and cooling systems in the basements and roof floors across campus. Take a look at the photos of some beautiful industrial engineering.
The electricity supply for the NEU campus comes in through a 14.000 Volt feed with an energy mix from the ISO New England electricity market into four substations on campus. Purchasing electricity at high voltage is less costly, and the University owns the substations and transformers in each building.
To a large extent the campus is divided into two distinct systems in terms of electricity with a separation along Forsyth street. This is no coincidence. Buried under Forsyth street runs a large water drain pipe and laying 14.000 Volt cables on top of this pipe was considered too close to the surface and thus too risky.
It turns out that lighting, while perhaps the most visible type of electricity consumption, does not in fact impact overall consumption greatly. There are motion detectors in many places that automatically switch off many of the indoor lighting sources in the absence of building occupants and there is an ongoing LED lamp substitution program that further reduces consumption of campus lighting.
And in fact the Energy Group on campus goes to great lengths to better fine tune just how much air and water to move to the various rooms depending on actual room occupancy – since a well air-conditioned room without anybody in it is wasted energy. Some of the techniques in place to monitor room occupancy are CO2 sensors and people counters based on camera technology which literally track incoming and outgoing residents to calculate room occupancy in real time.
From a different perspective, energy inefficiency is also age dependent. As buildings get older, they “drift”: they loose their tune, they get out of calibration. Over the years, sensor set-ups, valves and other parts of the system become less accurate and this together with the attempts to locally compensate, results in performance loss and can lead to an overall increase in energy consumption of these buildings. The Energy Group has recently committed itself to tackling a gradual recommissioning of several of the older campus buildings. A laborious process including a full examination and recalibration of the various building systems, that should significantly reduce overall consumption.
The students certainly walked away from this tour with many inspiring and deep insights into where the data comes from. They will be working with this data for the rest of this semester. Stay tuned for more updates.