This project was developed as part of my tenure at the Massachusetts Institute of Technology’s Senseable City Lab leading an interdisciplinary team of researchers.
New York Talk Exchange (NYTE) explores how a global city such as New York connects with cities around the world by visualizing long distance telephone and IP (Internet Protocol) data flows in real time. Questions that drive the exploration are: How does the city of New York connect to other cities? With which cities does New York have the strongest ties and how do these relationships shift with time? How does the rest of the world reach into the neighborhoods of New York?
“The striking piece of evidence coming out of this project is that global talk happens both at the top of the economy and at its lower end. The vast middle layers of our society are far less global; the middle talks mostly nationally and locally.”Saskia Sassen – NYTE project catalog
NYTE uses data flows from the AT&T network that measure the volume of Internet protocol (IP) and voice traffic flowing in and out of New York at a given time. The project was developed as part of the ‘Design and the Elastic Mind’ at MoMA between February 24th – May 12th 2008 and showcased as three distinct data visualizations.
Globe Encounters
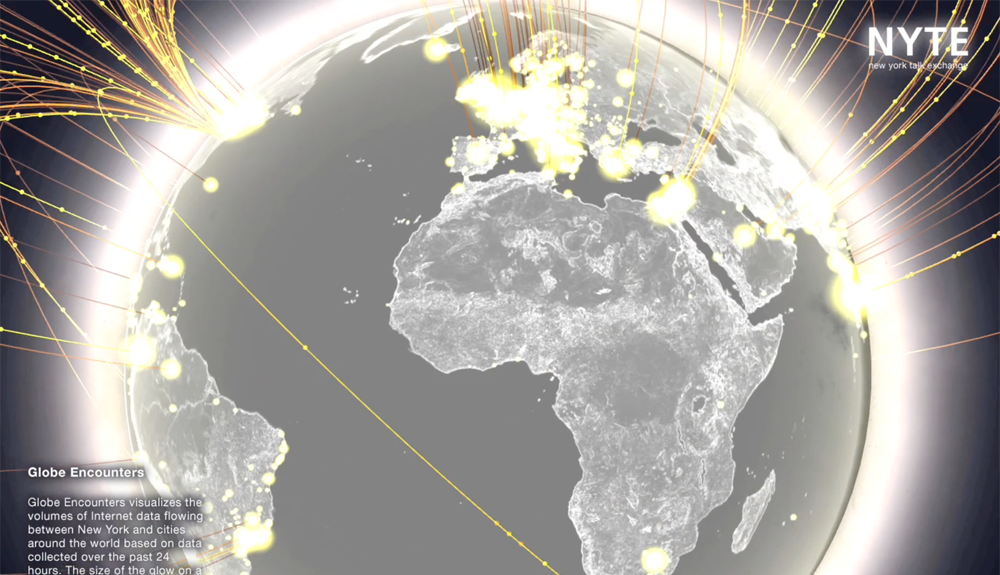
In the Information Age, the flow of IP (Internet Protocol) data between locations is nearly ubiquitous. Globe Encounters visualizes in real time the volumes of Internet data flowing between New York and cities around the world. The size of the glow on a particular city location corresponds to the amount of IP traffic flowing between that place and New York City. A greater glow implies a greater IP flow.
World Within New York
World Within New York shows how different neighborhoods reach out to the rest of the world via the AT&T telephone network. The city is divided into a grid of 2-kilometer square pixels where each pixel is colored according to the regions of the world wherein the top connecting cities are located. The widths of the color bars represent the proportion of world regions in contact with each neighborhood. Encoded within each pixel is also a list of the world cities that account for 70% of the communications with that particular area of New York.
Pulse of the Planet
Time zones influence the global rhythm of communications. Pulse of the Planet illustrates the volume of international calls between New York City and 255 countries over the twenty-four hours in a day. Areas of the world receiving and making fewer phone calls shrink while areas experiencing a greater amount of voice call activity expand. International cities with the most call activity to and from New York are highlighted according to time zone.
You can find further information on the MIT project page.
team
Carlo Ratti group director,
Kristian Kloeckl project leader,
Assaf Biderman, Franscesco Calabrese, Margaret Ellen Haller,
Aaron Koblin, Francisca Rojas, Andrea Vaccari
research advisors
William Mitchell, Saskia Sassen
at&t labs research
Alexandre Gerber, Chris Rath, Michael Merritt, Jim Rowland
project sponsor
AT&T


This project was developed as part of my tenure at the Massachusetts Institute of Technology’s Senseable City Lab leading an interdisciplinary team of researchers.
New York Talk Exchange (NYTE) explores how a global city such as New York connects with cities around the world by visualizing long distance telephone and IP (Internet Protocol) data flows in real time. Questions that drive the exploration are: How does the city of New York connect to other cities? With which cities does New York have the strongest ties and how do these relationships shift with time? How does the rest of the world reach into the neighborhoods of New York?
NYTE uses data flows from the AT&T network that measure the volume of Internet protocol (IP) and voice traffic flowing in and out of New York at a given time. The project was developed as part of the ‘Design and the Elastic Mind’ at MoMA between February 24th – May 12th 2008 and showcased as three distinct data visualizations.
Globe Encounters
In the Information Age, the flow of IP (Internet Protocol) data between locations is nearly ubiquitous. Globe Encounters visualizes in real time the volumes of Internet data flowing between New York and cities around the world. The size of the glow on a particular city location corresponds to the amount of IP traffic flowing between that place and New York City. A greater glow implies a greater IP flow.
World Within New York
World Within New York shows how different neighborhoods reach out to the rest of the world via the AT&T telephone network. The city is divided into a grid of 2-kilometer square pixels where each pixel is colored according to the regions of the world wherein the top connecting cities are located. The widths of the color bars represent the proportion of world regions in contact with each neighborhood. Encoded within each pixel is also a list of the world cities that account for 70% of the communications with that particular area of New York.
Pulse of the Planet
Time zones influence the global rhythm of communications. Pulse of the Planet illustrates the volume of international calls between New York City and 255 countries over the twenty-four hours in a day. Areas of the world receiving and making fewer phone calls shrink while areas experiencing a greater amount of voice call activity expand. International cities with the most call activity to and from New York are highlighted according to time zone.
You can find further information on the MIT project page.
team
Carlo Ratti group director,
Kristian Kloeckl project leader,
Assaf Biderman, Franscesco Calabrese, Margaret Ellen Haller,
Aaron Koblin, Francisca Rojas, Andrea Vaccari
research advisors
William Mitchell, Saskia Sassen
at&t labs research
Alexandre Gerber, Chris Rath, Michael Merritt, Jim Rowland
project sponsor
AT&T